
")
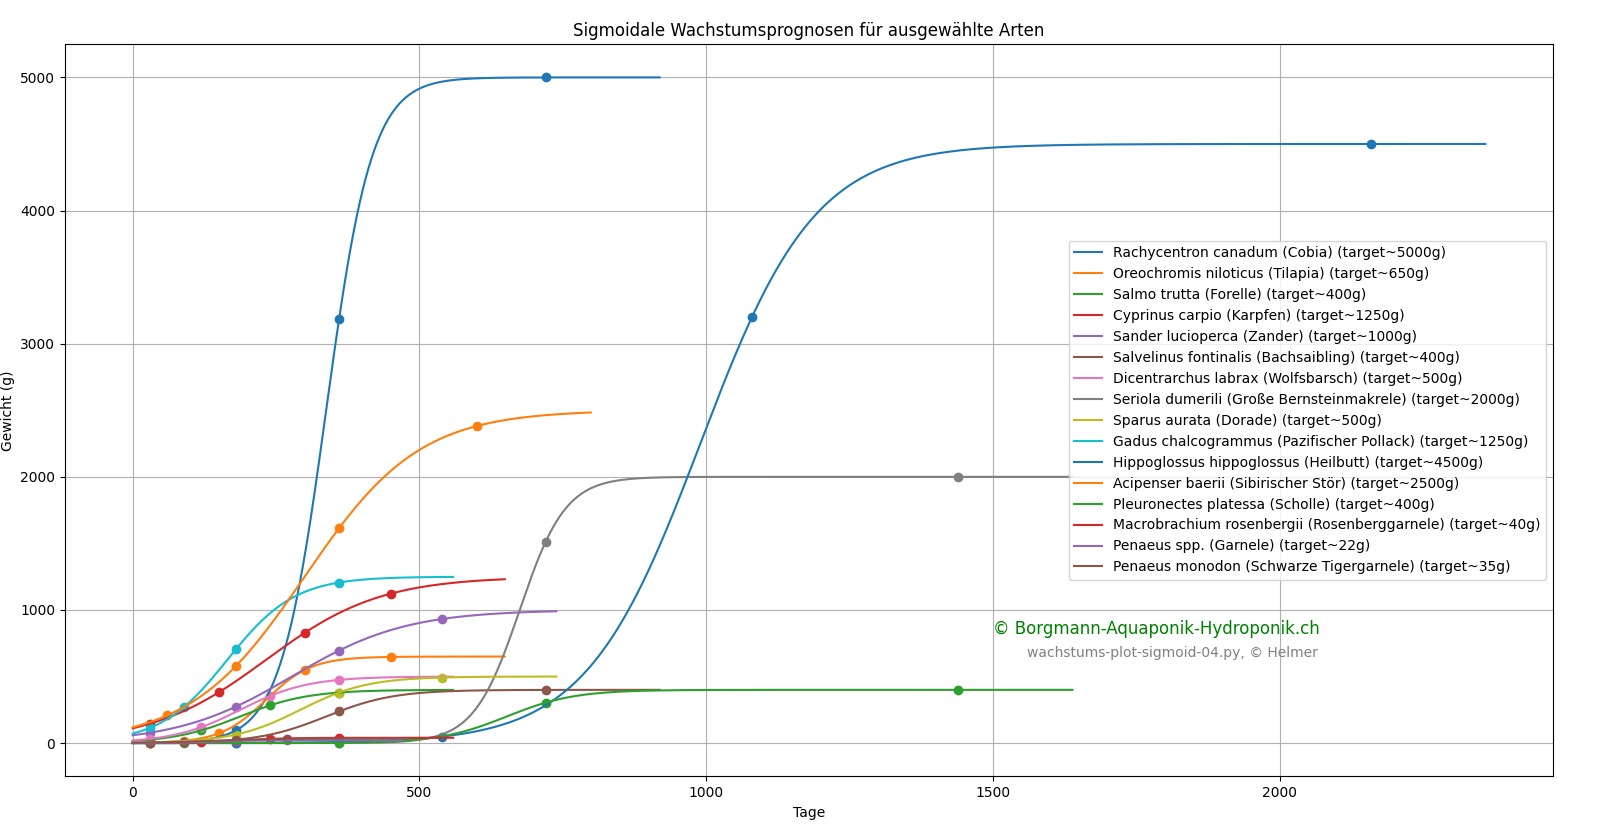
 For better estimation of filter load in aquaponics systems, we use the sigmoid function (logistic function) which is used in biology (and other domains) to describe and predict growth processes. It realistically describes the growth and the amount of feed required by fish. From the feed amount and thus the resulting waste, the NH4 and phosphorus concentration over the course of the rearing period can be better estimated.
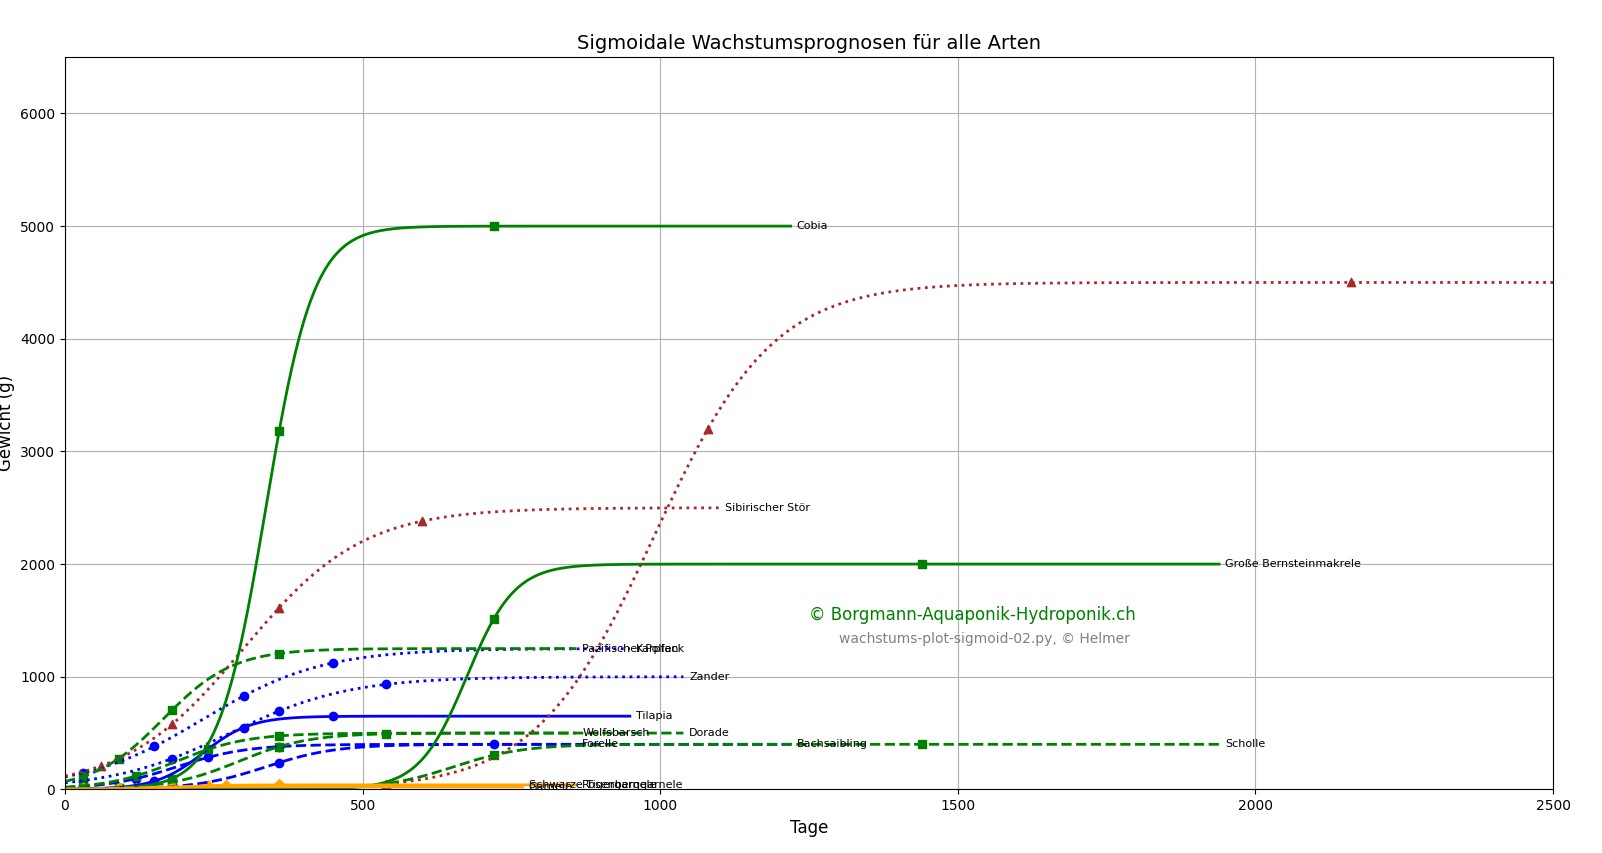
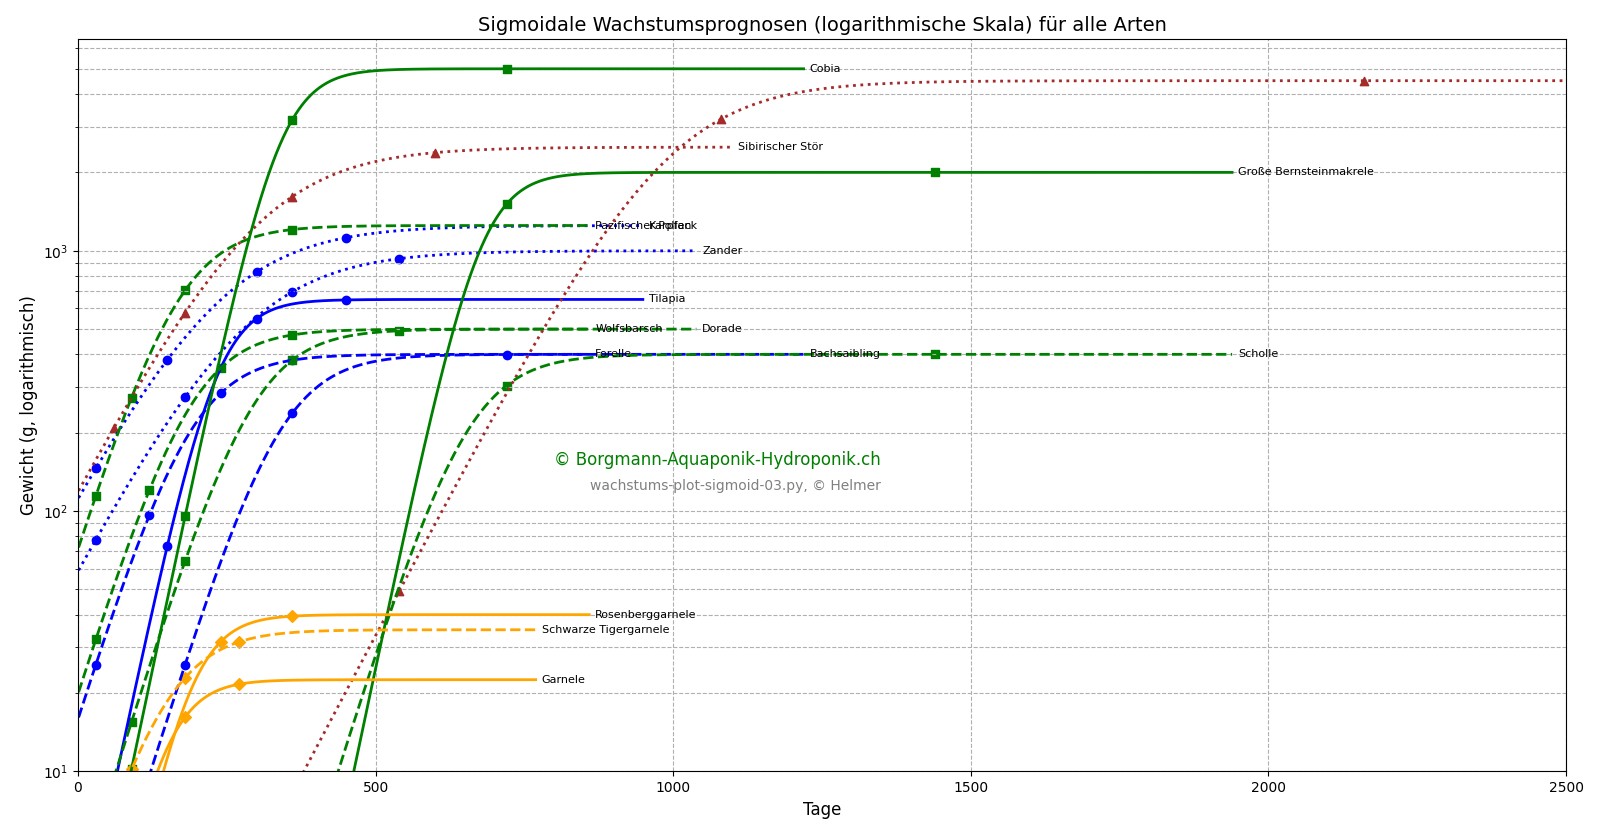
In biology, the individual length or weight growth of fish is often described with sigmoid curves (e.g., from a Gompertz- or von Bertalanffy-like model), in which:
- Early phase (I): slow growth → small body size, low feed intake
- Exponential phase (II): strong growth → high feed intake, high SGR (specific growth rate)
- Stationary phase (III): decreasing growth → nearly asymptotic plateau#
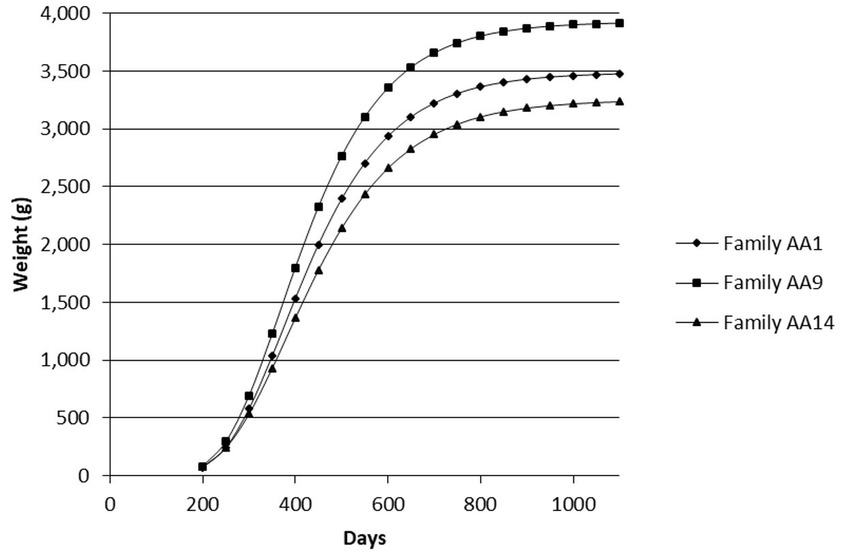
Literature: Jobling, M.: “Fish Bioenergetics” typically shows sigmoid growth curves for many species.
Image: Growth curve of Nile tilapia from different families of the AquaAmérica variety
Here is another graphic on koi growth to demonstrate the use of the sigmoid function.
Image: Koi Growth Rates
Add Comment